NON-PROSE MATERIALS
Non-prose materials are composed of graphs, tables, charts, diagrams and everything that does use minimal words to explain a particular thing. This was a project. The task was to make a table, bar graph, line graph, pie graph and a histogram. Each should have 5 comprehension questions.
CLICK SOURCE
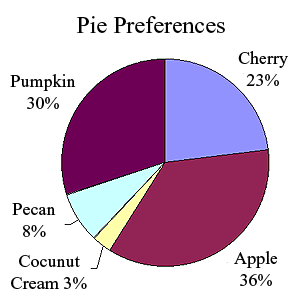
The above map is an example of a pie chart. Pie charts are used to show percetage data. You can tell how different variables relate to the whole topic. The example I found above shows pie preference. It is easy to tell that the most liked pie was Apple. The least liked pie is cocunut cream.
Line graphs are a way of showing raw data. Line graphs can be done in many different ways. Shading can be added to help emphasise data. Trend lines can be added to help the viewer better see the movement of the line also. The above line graph is very simple line graph. It is showing the tempatures of New York City.
Overview
The 3D Horizontal Bar Graph software provides both a client and server side solution for the incorporation of bar graphs and charts into web pages. It provides versatile components so that web authors and Java developers can easily build and publish dynamic and interactive bar charts
Both the applet and servlet are designed to take multiple series of numerical data and graph the information as 2D or 3D bar graphs. The applets and servlets can acquire data from a variety of sources including,
- Files
- Databases
- Scripts and server Side processes (eg. Servlets, JSP, ASP, PERL)
- HTML parameters
We have built in many configurable graph features and functions to both the applet and servlet and as such, the documentation and examples are designed to give both a full understanding of every feature and enable you to implement both the applet and servlet quickly and easily. The series of examples give an overview of the variety of implementations possible


No comments:
Post a Comment